Data Analysis and Visualization at Transeuropa Festival 2017

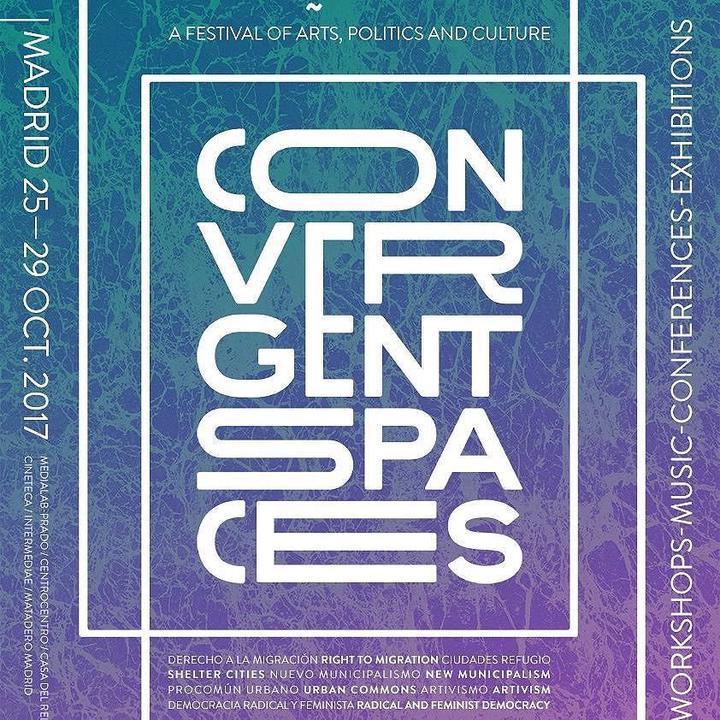
Data literacy workshop driven by open and free software tools to get free knowledge workshop for Transeuropa 2017, a festival of arts, politics and culture held at Medialab-Prado from 25 to 29 October 2017.
Data Visualisation is a transversal discipline which harnesses the immense power of visual communication in order to explain, in an understandable manner, the relationships of meaning, cause and dependency which can be found among the great abstract masses of information generated by scientific and social processes. J.L. de Vicente
Data literacy is the ability to read, create and communicate data as information and has been formally described in varying ways. Discussion of the skills inherent to data literacy and possible instructional methods have emerged as data collection becomes routinised and talk of data analysis and big data has become commonplace in the news, business, government and society in countries across the world.
A data-scientific view emphasises the numeric, statistical nature of data as information. This approach is based in improving the foundations of managing data driven by free and open source technologies: the command line, the text editor, standardised syntaxis and web technologies.